
Türkiye's water
Are our lakes shrinking?
Short answer
Water surface of 7 lakes, 1984–2021: 5 lakes shrank, 2 grew or did not change (JRC satellite archive).
Shrank most: Akşehir Gölü (92.3%, 1984→2021).
Only the difference between two measured years; no projection. Area = permanent + seasonal water surface within the year (JRC satellite archive).
Details
The yearly water surface of 7 lakes (Tuz, Burdur, Marmara, Van, Eğirdir, Beyşehir, Akşehir) was counted from the JRC Global Surface Water satellite archive (Landsat, 1984–2021): the difference between the first and last measured year, a yearly chart and a before/after image. No score, no ranking, no forecast.
For each lake: a before/after image, a yearly area chart and the difference between the first and last measured year. Years without observations (in most lakes 1988–1997, a gap in the Landsat archive) are left blank in the chart; no number is produced for them.
Tuz Gölü lake page (Turkish)
grew by 9.9% (1984→2021, measured years) 897 km² → 986 km²
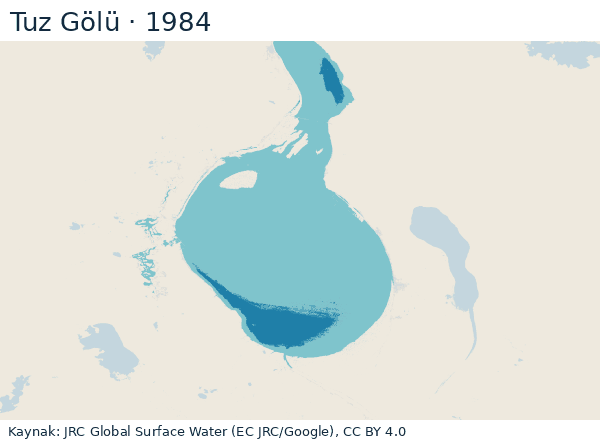
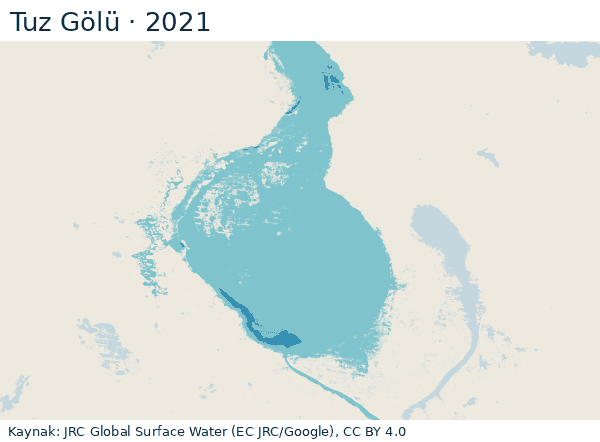
Permanent water 1984: 92 km² → 2021: 23 km²; seasonal water 1984: 805 km² → 2021: 963 km². Lake mask 1,063 km² (combined water surface 1984–2021). No observation (9 years): 1988–1989, 1991–1997 — blank in the chart.
Latest satellite image (9 October 2026): water surface within the lake mask 213 km². A single-day image, not the same measure as the yearly total; scene cloud share 2.1%. Source: Copernicus Sentinel-2 L2A (AWS Earth Search STAC), Contains modified Copernicus Sentinel data 2026.
Source: JRC Global Surface Water v1.4, Yearly Water Classification History (EC JRC/Google), CC BY 4.0 · accessed 25 October 2026 · data (JSON)
Burdur Gölü
shrank by 30.1% (1984→2021, measured years) 195 km² → 136 km²
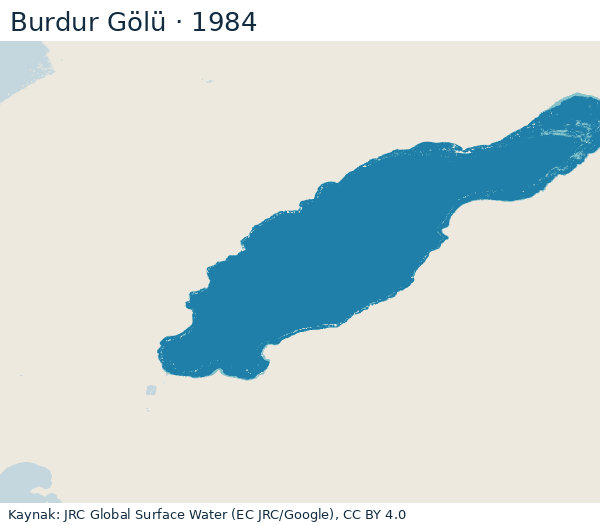
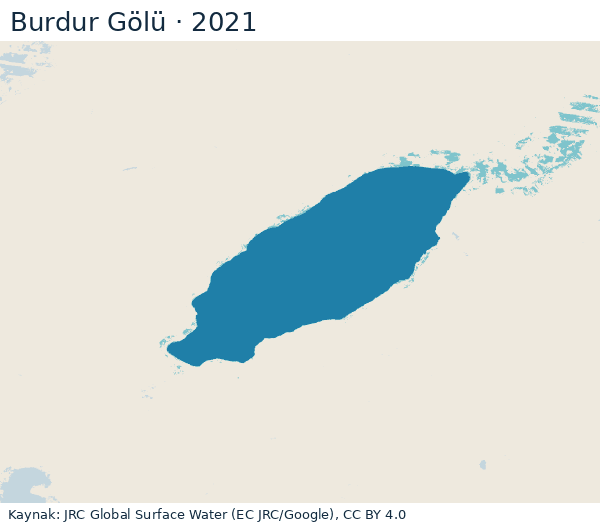
Permanent water 1984: 190 km² → 2021: 122 km²; seasonal water 1984: 5 km² → 2021: 14 km². Lake mask 195 km² (combined water surface 1984–2021). No observation (10 years): 1985, 1988–1994, 1996–1997 — blank in the chart.
Latest satellite image (10 October 2026): water surface within the lake mask 115 km². A single-day image, not the same measure as the yearly total; scene cloud share 0.1%. Source: Copernicus Sentinel-2 L2A (AWS Earth Search STAC), Contains modified Copernicus Sentinel data 2026.
Source: JRC Global Surface Water v1.4, Yearly Water Classification History (EC JRC/Google), CC BY 4.0 · accessed 25 October 2026 · data (JSON)
Marmara Gölü
shrank by 54.1% (1984→2021, measured years) 60 km² → 27 km²
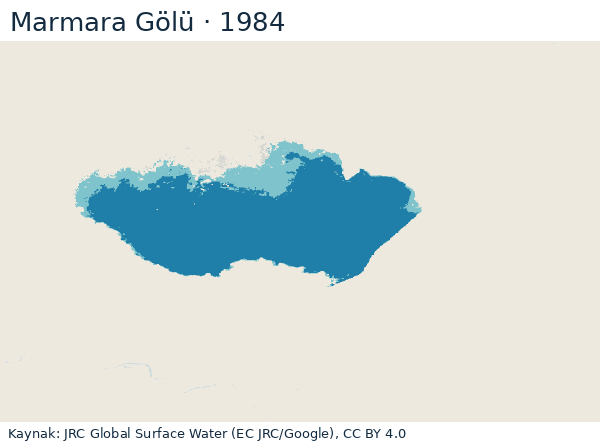
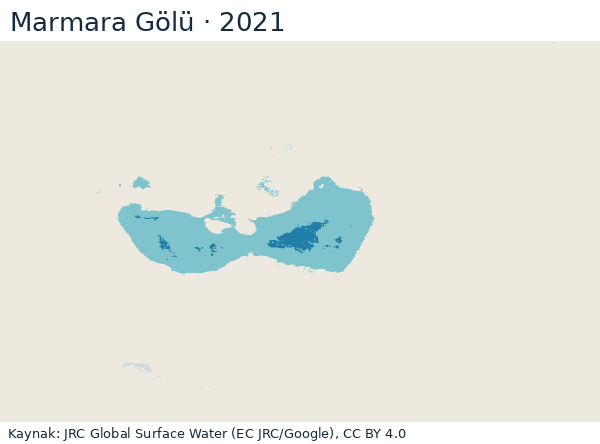
Permanent water 1984: 50 km² → 2021: 2 km²; seasonal water 1984: 10 km² → 2021: 25 km². Lake mask 64 km² (combined water surface 1984–2021). No observation (11 years): 1985, 1988–1994, 1996–1998 — blank in the chart.
Latest satellite image (10 October 2026): water surface within the lake mask 4 km². A single-day image, not the same measure as the yearly total; scene cloud share 0.0%. Source: Copernicus Sentinel-2 L2A (AWS Earth Search STAC), Contains modified Copernicus Sentinel data 2026.
Source: JRC Global Surface Water v1.4, Yearly Water Classification History (EC JRC/Google), CC BY 4.0 · accessed 25 October 2026 · data (JSON)
Van Gölü lake page (Turkish)
grew by 0.4% (1984→2021, measured years) 3,564 km² → 3,577 km²
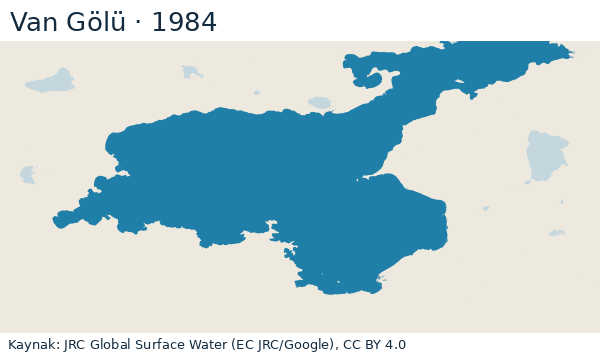
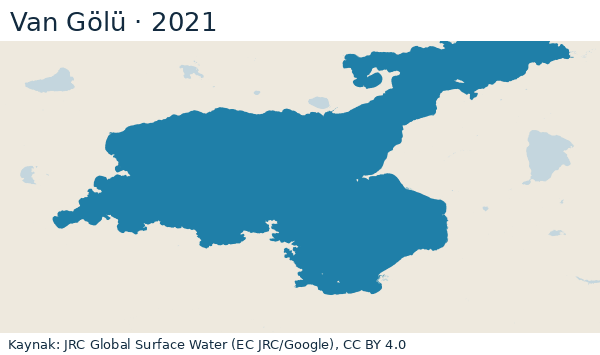
Permanent water 1984: 3,561 km² → 2021: 3,566 km²; seasonal water 1984: 3 km² → 2021: 11 km². Lake mask 3,596 km² (combined water surface 1984–2021). No observation (10 years): 1985, 1988–1989, 1991–1997 — blank in the chart.
Latest satellite image (10 October 2026): water surface within the lake mask 3,745 km². A single-day image, not the same measure as the yearly total; scene cloud share 1.7%. Source: Copernicus Sentinel-2 L2A (AWS Earth Search STAC), Contains modified Copernicus Sentinel data 2026.
Source: JRC Global Surface Water v1.4, Yearly Water Classification History (EC JRC/Google), CC BY 4.0 · accessed 25 October 2026 · data (JSON)
Eğirdir Gölü lake page (Turkish)
shrank by 4.1% (1984→2021, measured years) 471 km² → 452 km²
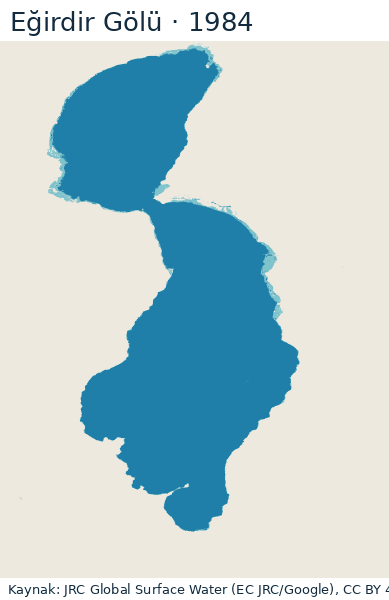
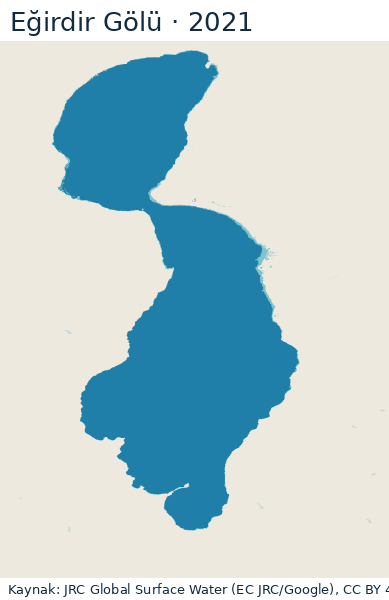
Permanent water 1984: 455 km² → 2021: 444 km²; seasonal water 1984: 16 km² → 2021: 8 km². Lake mask 471 km² (combined water surface 1984–2021). No observation (11 years): 1985, 1988–1997 — blank in the chart.
Latest satellite image (9 October 2026): water surface within the lake mask 349 km². A single-day image, not the same measure as the yearly total; scene cloud share 1.4%. Source: Copernicus Sentinel-2 L2A (AWS Earth Search STAC), Contains modified Copernicus Sentinel data 2026.
Source: JRC Global Surface Water v1.4, Yearly Water Classification History (EC JRC/Google), CC BY 4.0 · accessed 25 October 2026 · data (JSON)
Beyşehir Gölü lake page (Turkish)
shrank by 5.5% (1984→2021, measured years) 683 km² → 646 km²
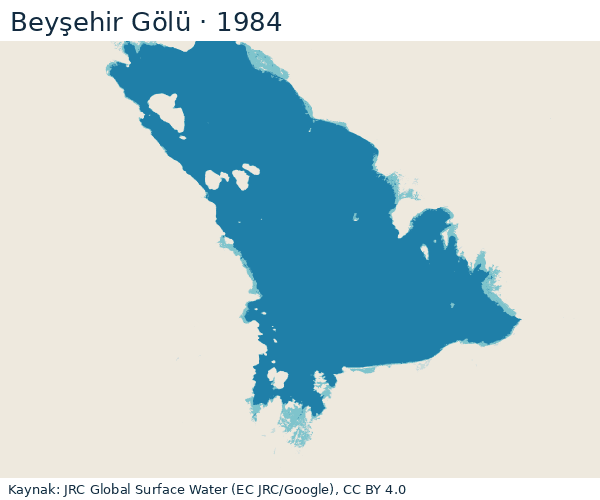
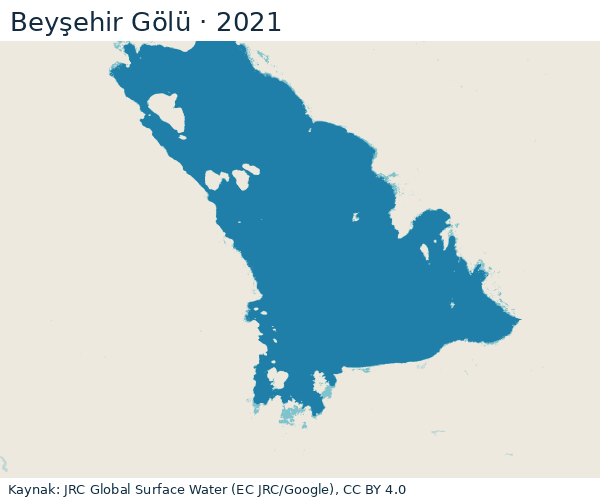
Permanent water 1984: 633 km² → 2021: 622 km²; seasonal water 1984: 50 km² → 2021: 24 km². Lake mask 691 km² (combined water surface 1984–2021). No observation (9 years): 1988–1989, 1991–1997 — blank in the chart.
Latest satellite image (19 October 2026): water surface within the lake mask 606 km². A single-day image, not the same measure as the yearly total; scene cloud share 0.9%. Source: Copernicus Sentinel-2 L2A (AWS Earth Search STAC), Contains modified Copernicus Sentinel data 2026.
Source: JRC Global Surface Water v1.4, Yearly Water Classification History (EC JRC/Google), CC BY 4.0 · accessed 25 October 2026 · data (JSON)
Akşehir Gölü
shrank by 92.3% (1984→2021, measured years) 338 km² → 26 km²
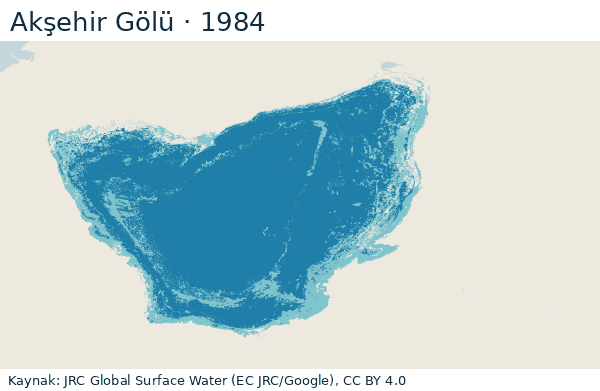
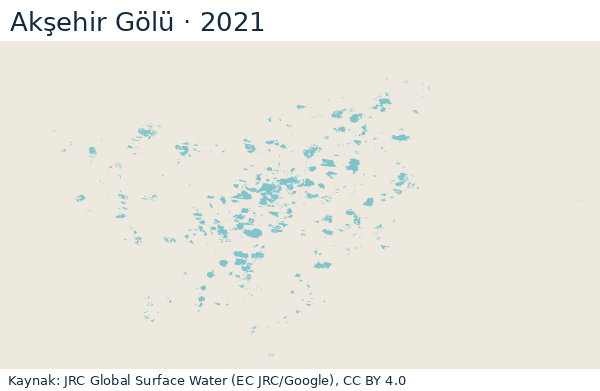
Permanent water 1984: 260 km² → 2021: 0 km²; seasonal water 1984: 79 km² → 2021: 26 km². Lake mask 339 km² (combined water surface 1984–2021). No observation (11 years): 1985, 1988–1997 — blank in the chart.
Latest satellite image (9 October 2026): water surface within the lake mask 28 km². A single-day image, not the same measure as the yearly total; scene cloud share 0.2%. Source: Copernicus Sentinel-2 L2A (AWS Earth Search STAC), Contains modified Copernicus Sentinel data 2026.
Source: JRC Global Surface Water v1.4, Yearly Water Classification History (EC JRC/Google), CC BY 4.0 · accessed 25 October 2026 · data (JSON)
Detailed datamethod, limits, year-by-year table, licence
Method
A fixed geographic box for each lake; only this window is read from the JRC yearly classification tiles (GDAL /vsicurl/, no full tile download). Lake mask: the 8-connected component of the combined 1984–2021 water surface (class 2 or 3) that contains the lake's centre point; neighbouring lakes and other water in the box lie outside the mask. Yearly area = area of permanent (3) + seasonal (2) water pixels within the mask; pixel area by latitude with a spherical approximation (R = 6371.0088 km). A year whose share of unobserved (0) pixels within the mask exceeds 20% is labelled "no data"; the first and last year are the first and last year without that label. The percentage difference is only the difference between these two measured years; there is no projection.
Pixel: 0.00025° × 0.00025° (about 28 m × 22 m at this latitude; the JRC product is 30 m Landsat based). Classes: 0 no observation, 1 not water, 2 seasonal water, 3 permanent water (JRC user guide v2024.5, "Yearly History"). In the JEODPP tiles, pixels that never showed water in 1984–2021 carry the value 0 (class 1 occurs only within the combined water surface; verified in the boxes of the 7 lakes). The share of no-observation pixels is therefore computed only within the lake mask.
Limits
Seasonal water reflects the widest extent within the year; permanent and seasonal are given separately. Landsat observation frequency is low in the early years; cloud and observation gaps raise the no-data share. Because the mask is fixed, exceptional water outside the mask (floods) is not counted. Water surface touching the box edge may be cut off.
Latest Sentinel-2 measurement
Son N gün içinde bulut oranı eşiğin altındaki Sentinel-2 L2A sahneleri STAC ile aranır; aynı güne ait sahnelerin kapsama alanı göl kutusunu tam örtüyorsa o gün adaydır, en az bulutlu gün seçilir. B03 ve B08 bantlarından yalnız kutu penceresi okunur (0,0002°); NDWI > 0 (yeşil > yakın kızılötesi) su sayılır; SCL sınıfları 0, 1, 3, 8, 9, 10, 11 geçersizdir. Alan, JRC göl maskesi içinde piksel alanlarının toplamıdır. Tek günlük görüntüdür; JRC yıllık (kalıcı + mevsimsel) toplamıyla aynı ölçü değildir. Göl maskesi içinde geçersiz (bulut/gölge/kar) piksel oranı %20'yi aşan ölçüm uyarılı gösterilir; sığ ve tuzlu yüzeylerde NDWI su/kuru ayrımı belirsiz olabilir.
Accessed 3 November 2026; Contains modified Copernicus Sentinel data 2026.
Water surface year by year (km², permanent + seasonal)
| Year | Tuz | Burdur | Marmara | Van | Eğirdir | Beyşehir | Akşehir |
|---|---|---|---|---|---|---|---|
| 1984 | 897 | 195 | 60 | 3,564 | 471 | 683 | 338 |
| 1985 | 318 | no observation | no observation | no observation | no observation | 592 | no observation |
| 1986 | 968 | 192 | 55 | 3,564 | 464 | 665 | 286 |
| 1987 | 998 | 193 | 62 | 3,568 | 471 | 672 | 322 |
| 1988 | no observation | no observation | no observation | no observation | no observation | no observation | no observation |
| 1989 | no observation | no observation | no observation | no observation | no observation | no observation | no observation |
| 1990 | 1,018 | no observation | no observation | 3,576 | no observation | 594 | no observation |
| 1991 | no observation | no observation | no observation | no observation | no observation | no observation | no observation |
| 1992 | no observation | no observation | no observation | no observation | no observation | no observation | no observation |
| 1993 | no observation | no observation | no observation | no observation | no observation | no observation | no observation |
| 1994 | no observation | no observation | no observation | no observation | no observation | no observation | no observation |
| 1995 | no observation | 167 | 33 | no observation | no observation | no observation | no observation |
| 1996 | no observation | no observation | no observation | no observation | no observation | no observation | no observation |
| 1997 | no observation | no observation | no observation | no observation | no observation | no observation | no observation |
| 1998 | 983 | 161 | no observation | 3,594 | 454 | 634 | 223 |
| 1999 | 802 | 162 | 53 | 3,593 | 464 | 659 | 210 |
| 2000 | 1,011 | 159 | 60 | 3,590 | 466 | 644 | 222 |
| 2001 | 712 | 156 | 56 | 3,582 | 461 | 629 | 176 |
| 2002 | 986 | 155 | 58 | 3,580 | 460 | 647 | 208 |
| 2003 | 992 | 158 | 62 | 3,581 | 462 | 646 | 213 |
| 2004 | 730 | 160 | 61 | 3,585 | 467 | 653 | 204 |
| 2005 | 851 | 159 | 58 | 3,588 | 463 | 639 | 163 |
| 2006 | 956 | 155 | 58 | 3,589 | 458 | 632 | 119 |
| 2007 | 813 | 154 | 51 | 3,589 | 462 | 636 | 123 |
| 2008 | 971 | 148 | 38 | 3,584 | 458 | 635 | 97 |
| 2009 | 1,014 | 146 | 55 | 3,583 | 456 | 642 | 142 |
| 2010 | 989 | 149 | 55 | 3,582 | 458 | 658 | 139 |
| 2011 | 1,010 | 144 | 59 | 3,583 | 459 | 660 | 127 |
| 2012 | 1,029 | 142 | 62 | 3,585 | 461 | 682 | 128 |
| 2013 | 1,010 | 142 | 62 | 3,584 | 462 | 685 | 124 |
| 2014 | 1,021 | 141 | 57 | 3,583 | 461 | 669 | 40 |
| 2015 | 1,040 | 143 | 63 | 3,582 | 464 | 667 | 162 |
| 2016 | 985 | 136 | 63 | 3,582 | 465 | 658 | 107 |
| 2017 | 1,038 | 138 | 53 | 3,583 | 461 | 657 | 100 |
| 2018 | 1,040 | 134 | 46 | 3,581 | 458 | 650 | 94 |
| 2019 | 1,039 | 130 | 52 | 3,581 | 456 | 653 | 98 |
| 2020 | 1,044 | 127 | 38 | 3,579 | 455 | 654 | 108 |
| 2021 | 986 | 136 | 27 | 3,577 | 452 | 646 | 26 |
Source and licence
EC JRC/Google — Global Surface Water Explorer, Yearly Water Classification History v1.4 (1984–2021) — download page, tile directory. Licence statement (verbatim): Any copyright and/or sui generis right on the dataset is licensed under the Creative Commons Attribution 4.0 International (CC BY 4.0) licence. Reuse is allowed provided appropriate credit is given and any changes are indicated. (https://jeodpp.jrc.ec.europa.eu/ftp/jrc-opendata/GSWE/copyright.txt, (c) European Union, 1995-2021)
Citation: Jean-Francois Pekel, Andrew Cottam, Noel Gorelick, Alan S. Belward, High-resolution mapping of global surface water and its long-term changes. Nature 540, 418-422 (2016). doi:10.1038/nature20584. Map credit: Source: EC JRC/Google
.
Derived figures and images on this page: /veri/gol-alan.json (CC BY 4.0; source licence separate).